
This article (still in process of being written) seeks to address the issues regarding the manipulation of patient information. The analysis, interpretation and presentation of data extracted from the managerial information database is discussed in the article on Business Intelligence (yet to be written).
DATA MANAGEMENT
The Health-care Information System (HIS) is designed to enable the gathering and storage of data and then making them available as information for primary and secondary use. Primary use refers to the use of data or information for performing operations work (i.e. caring for the patient). Secondary use refers to use of data outside the scope of actual care of the patient for purposes such as audit and research. For both, data about a single patient or a group of patients are presented in raw or derived form. Details regarding the primary use of data is discussed in detail in the article on Clinical Information System.
DATA MANAGEMENT PROCESS
Data management is a set of activities consisting of:
- Data generation
- Data acquisition (collection, gathering, capture)
- Data transfer
- Data storage
- Data extraction
- Data analysis
- Data interpretation
- Data presentation
- Data dissemination
DATA EXTRACTION
In the Health-care Information System, data originates from two main sources i.e. Clinical and Managerial. Conceptually, they are stored in two separate databases. However, both clinicians and managers may use data from both sources.
PURPOSE OF DATA EXTRACTION
In the activity of data extraction, certain identified data are taken out of the database and compiled for analysis. This task can be performed as a query of the database by a programmer or by any user through the use of a data extraction tool (application). A query is a programming script written in data query language (e.g. SQL) that is used to select certain data from any part of the database and to group or list them.
The data being extracted may be:
- confined to that of a single entity (a patient or any other entity)
- belong to a group of entities
Data of a Single Entity
In HIS, the entity that is of greatest interest to clinicians is the patient. However, managers at every level would also be interested in data about other entities such as service units, personnel, equipment and consumables. Data regarding a single entity are extracted in order to show:
- the variations of attributes (characteristics, features, results) over time
- the actions taken (tasks, interventions, chronology of events)
- the events that happened (incidents)
- correlation between the above three
Clinicians would like to know the progress of the patient over time. By extracting and presenting the changes of a single attribute or set of attributes during the visit or throughout the care episode, a graph or chart is created. Changes and trends shown on the graph will help the clinician determine the patient’s progress. The temperature, respiratory rate, pulse and blood pressure chart (vital signs chart) is an example of the use of data extraction. The growth chart is an example of presentation of data captured during various visits and episodes. Such results of extraction and analysis are usually presented in real-time as views and displays in various modules of HIS.
Indeed, the entire Electronic Medical Record is an extract of the Patient Information Database.
Data regarding a single patient are also extracted for purposes of:
- qualitative studies
- inquiries
- audit
Data of a Group of Entities
For purposes of managerial oversight, audit and research, data from a group of entities is extracted and manipulated so as to give an idea about the similarities or differences between members of the group. The group can be all the entities (the entire population) residing in the database. Often, only a subset of that population is being looked at. One of the main purposes of data extraction is to create sub-sets of the entire population known as Registers e.g. Hospital Birth Registry. Often, clinicians are interested in studying a group of patients selected based on certain criteria such as diagnosis, presentation, severity or the type of treatment given.
Once data (attributes) of a group of entities are available, then analysis and interpretation of the data can be performed. If the group is large enough then statistical analysis can be used, making the conclusions more valid.
DATA ANALYSIS
Analysis refers to the act of
- computation,
- categorization
- comparison
- manipulation
The purpose of analysis is to compare (similarities and differences) the attributes of a single entity or entities within a group. The differences are determined by comparing the measurement/magnitude/level between a certain value with:
- the previous value (change)
- a standard (deviation from normal)
- the variations of attributes (characteristics, features, results) over time (trend)
The key requirement is the ability to identify any change that have occurred to an attribute (for a single entity) or the number of entities (within a group) that have this change. The ability to differentiate leads to ability to count. Entities are easily identified but the exercise of differentiating and counting of attributes is very challenging. It depends mainly on two factors:
- ability to measure the attribute
- ability to group them according to certain criteria
Measurements of attributes can be direct or indirect. For some attributes, it is sufficient to know whether they exist or do not. Physical attributes like size, weight, pressure and temperature are usually measured by some instrument and values given in standard units of measure. Yet, a further step i.e. setting the upper and lower limits of measurements that define the group need to be done in order to group entities based on these values.
Qualitative attributes, on the other hand, are not directly measurable. There is a need to convert the conceptual definition of the attribute to an operational definition. Characteristics such as success-failure, improvement, effectiveness, safety and appropriateness cannot be measured directly. Instead proxy or surrogate measures are used. For example a combination of measurements of temperature, heart rate and white blood cell count may be used to indicate the response of a patient with an infection to treatment. However, quite often in clinical care, care-providers make value judgements based on their knowledge and experience (implicit criteria) without measuring qualitative characteristics (explicit criteria). Values may also be computed mathematically to give derived data. For example,:
- values can be converted from actual measurements to proportions or percentages
- values for a particular attribute of several entities in a group can be computed to give an aggregate or an average
- values for each attribute in a group is given a arbitrary value and then added to give a score
- values can be multiplied with a factor to give a resultant value
When looking at a group of entities and its attributes, analysis is done mainly using statistical methods. These can be simple descriptive statistics giving rise to knowledge regarding:
- Average values (mean and median)
- Incidence
- Prevalence
- Rates
- Frequency
- Distribution
INTERPRETATION
Data that is analyzed is easier to interpret than raw data. Interpretation refers to the activity of using various means to reach a conclusion. These means include:
- Comparison
- Inference
- Projection
Conclusions are judgements reached through the use of informal deduction or inferential statistics. Inferential statistics can be used to:
- Determine the variability of an attribute within a single population
- Distinguish differences between two groups
- Infer a general conclusion based on a sample rather than studying the entire population
- Postulate trends
The activity and tools of analysis and interpretation in a Health-care Information System is used mainly for observational studies i.e. discovering what is going on and to infer from it. It uses data that is normally collected and stored. Inferential statistics can be used to observe:
- variations in the work practice
- behaviour of different segments of a population (groups)
- degree of conformance to work procedure
- the outcome characteristics
It is important to address experimental studies such as trials separately because they involve divergence from normal practice, the collection of additional data and require careful supervision.
DATA PRESENTATION
Data Presentation Charts and Graphs

REPORTS
Reports are the documented information and knowledge derived from data that has been analyzed and interpreted. The usefulness of the information depends to a certain extent in the way it is presented. Reports usually take the form of a mix of narrative (text), a matrices (tables) and charts (graphic depiction).
SOFTWARE / TOOLS FOR DATA EXTRACTION, ANALYSIS, REPORTING AND PRESENTATION
A complete set of data extraction tools for data extraction and reporting services should be supplied as part of HIS. In addition third party data statistical tools (such as SPSS) or complete data reporting suites (such as Business intelligence and ERP applications) can be procured for use. Programmers can also write their own queries.
REAL-TIME VIEWS AND DISPLAYS
Data of a single patient residing in the operations Patient Information Database are routinely extracted, analyzed and presented as real-time views or displays that can take the form of tables, running charts and control charts. For administrative and managerial purposes, data of several patients may also be extracted grouped together and presented as lists or a white-board display. These are not called reports despite actually being a ‘query of the database’. They are used mainly by service managers for control of operations. Indeed, this function is part of the Hospital Information System.
TYPES OF REPORTS
Reports are used by various users and managers of the institution or at higher management levels to:
- facilitate the business managerial functions and clinical governance within the hospital/health care facility
- provide data to external agencies (e.g. those within the Ministry of Health) for use at the community and national levels
Reports can be made available in two modes:
- Standard Reports
- Ad hoc reports
Standard reports are those generated and used on a regular basis. The data elements that form the basis for the report and how it is to be presented is known in advance. Data is then extracted using pre-prepared ‘queries’ at fixed times/intervals or on demand. Ad hoc reports, on the other hand, are those made available on request. System administrators (programmers) should have the capability using various tools (software) and writing query scripts for ad hoc data extraction to enable them to produce reports requested by users and the hospital authority.
Standard Reports
These latter include reports on current performance such as the Health Management Information System Reports (HMIS), Information Documentation System Reports (IDS), Disease, Disease Registry Reports and Quality Assurance reports.
Health care facility managers, both administrative and clinical, need an information system capable of analysis of data of the individual patient and more importantly of a population of patients grouped according to specified criteria for various purposes.
This capability to generate reports and make them available to managers and external agencies (e.g. the Ministry of Health) should be in-built in any HIS. Otherwise, a third party analysis and reporting system need to be procured. Its function would be to and keep them in a repository before distributing them to agencies involved in planning, budgeting, resource allocation and performance monitoring.
Reports on individual patients provide the means of interactions and communications between care providers. Similar reports may be sent to databases both internal and external (e.g. registries) to be grouped as data for a population of patients.
Hospital would require functionalities / reports that are standard (routine, pre-determined, pre-designed) plus as and when required (ad hoc). The list shown in the table below is not comprehensive but includes essential modules:
SYSTEM REQUIREMENTS
In the Hospital Information System, conceptually, there are two main types of data stored in two databases. Clinical data is stored in the Patient Information Database. Information regarding the provision of hospitality services and the upkeep of the physical facility is stored in the Managerial Information Database and used mainly for the management of the hospital as a business entity but may also be utilized for purposes of patient care. At the same time patient data that has been made anonymous and grouped may also be used by managers.
Analysis, presentation and interpretation of clinical data could be performed on data from two (2) sources:
- Real-time operations data residing in Patient Information Database
- Historical data within the Analytical Database
Software / Tools for Data Extraction and Analysis
A complete set of data extraction tools for data extraction and reporting services should be supplied as part of HIS.
Reports are documented information and knowledge derived from data that has been analyzed and interpreted. The usefulness of the information depends to a certain extent in the way it is presented. In can be in the form of a narrative (text), a matrix (tables) or charts (graphic depiction).
Real-time Views and Displays
Data of a single patient residing in the the Patient Information Database are routinely extracted, analyzed and presented as real-time views or displays that can take the form of tables, running charts and control charts. For administrative and managerial purposes, data of several patients may also be extracted grouped together and presented as lists or and a white-board display. These are not called reports despite actually being a ‘query of the database. They are used mainly by service managers for control of operations. Indeed, this function is part of the Clinical Information System.
SYSTEM ARCHITECTURE: HARDWARE
Data can be extracted from the Operations Database or a duplicate Analytical database (or data warehouse) to produce reports that can take the form simple statistical tables and charts or more complex modes of presentation.
An outline of the system architecture for real-time reporting is provided below:
System Architecture to Facilitate Analysis and Presentation of Patient Data

Report on analyzed historical data should be based on extraction of data from an Analytical database and used both for Operations functions and the Health Management Information System.
The Analytical database is a replica of the operations database containing asynchronous “snapshot” operations data (slightly delayed or off sync). Its use would lessen the need for data query to be performed on the Operations database thus reducing congestion and preventing interference with system performance.
An outline of the system architecture for extraction and analysis of historical data is provided below:
System Architecture To Facilitate Analysis And Presentation Of Historical Data

Use of data for Clinical Governance
A very effective way of measuring quality in healthcare is the use of Medical Audit and the monitoring of indicators. The most important standard to be set is that relating to the outcome of care. Input and process standards will then be set so as to achieve the desired outcome. The role of clinical governance is to advocate general principles by which standards are set in terms of the criteria and the measurements to be used as well as the level expected. It is the duty and responsibility of departments, units and care providers (individually or as a team) to determine the standards for their service products.
Therefore, the most important criterion for quality is whether the care given solves or alleviate the clients health problems. The characteristics of the outcome of care should include:
- effectiveness (relative to the type and severity of illness)
- safety (avoidance of the harmful effects of treatment)
- comprehensiveness
- continuity
Health Data Exchange for Shared Care
In a healthcare network, the same patient is managed at different facilities belonging to the same business group. Hence, a patient may receive the initial care (e.g. primary care), referred to another facility for (secondary or tertiary care) and then referred back to another for rehabilitation or follow up. To facilitate this continuity of care, it is essential that data is shared between these institutions.
The Healthcare Network
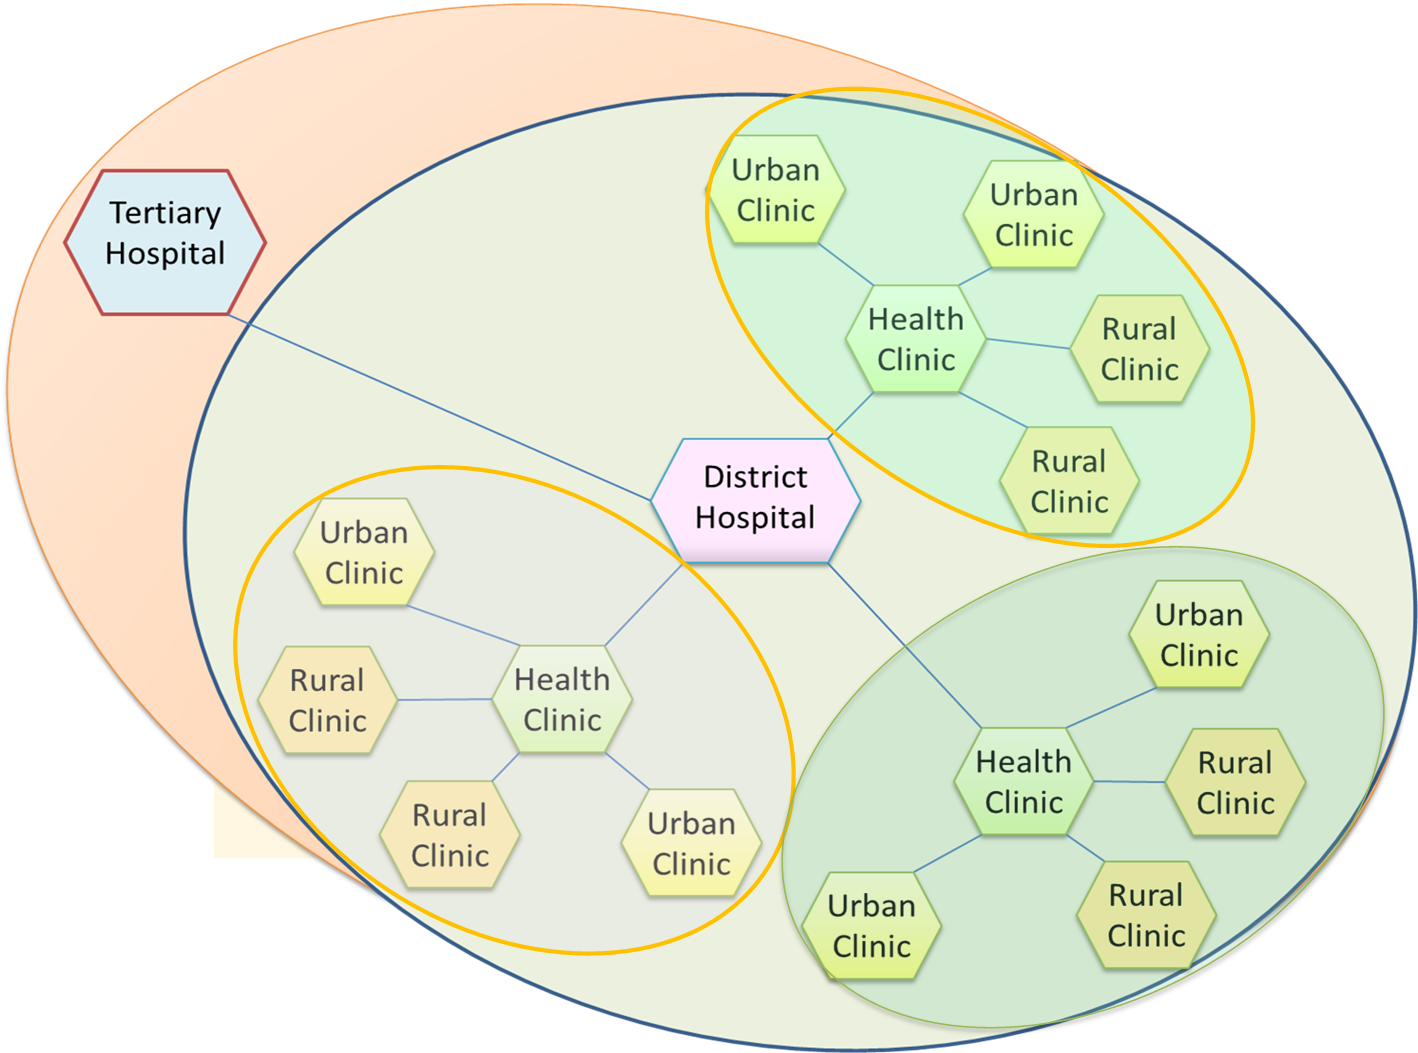
Rather than share each others database in real time, a shared database containing summarized data is a more viable option. Individual institutions can submit analyzed and interpreted data (reports) such as case/discharge summary, visit list, problem list and health plans to the central database (commonly termed as the Health Data Exchange). By submitting such data as a batch (in a store and forward manner) at a convenient time, the system network requirements would be less demanding. The Health Data Exchange can be made to contain constantly updated Lifetime Time Health Record and the Lifetime Health Plan of patients within the care network enabling integration of care.
Shared Operations Database in a Healthcare Network.

Enterprise Data Warehouse
Health care facilities can be stand alone institutions or part of a business conglomerate or a network of government run healthcare facilities. It would be useful for managers of conglomerates or healthcare networks to have at their disposal information derived from data pooled from the various facilities. Data from HIS database of each institution can be automatically extracted and submitted at appropriate time to a centralized database termed as the Data Warehouse.
The uses of such data include:
- Business Intelligence
- Enterprise Resource Planning
- Strategic Planning
Enterprise Resource Planning for Operations
Most of decisions pertaining to the business operations will be made by managers at the institution/facility level. However in a large organization or an enterprise, there are advantages for certain aspects of business operations to be planned, controlled and enhanced from the head office. Opportunities for integration and sharing of resources throughout the enterprise need to be appraised and acted upon. The areas include
- Procurement
- Maintenance of facility and equipment
- Staff Recruitment and deployment
- Control over service standards and facility
- Marketing
Procurement of raw material and equipment would benefit from economies of scale. Hence knowing current inventory and purchasing needs will allow bulk purchases.
Maintenance of facility and equipment of major sophisticated equipment may be more efficiently provided via an enterprise-wide service (e.g. a contract covering the entire enterprise). Having a centralized facility and equipment maintenance information system can be very useful.
Recruitment and deployment of some categories of staff may also be done at headquarters level.
Project Management
The conglomerate may also decide to implement initiatives throughout the enterprise e.g. marketing or public/customer relations exercises using centrally allocated resources. Information from the various implemented sites need to be pooled, analyzed and interpreted to determine progress and outcome.
Strategic Planning
By accumulating from across the enterprise over a period of time the organization can demonstrate current status and project (future) trends regarding all aspects of business. Such data can aid the management in making decisions regarding the need to re-look at the success or failure of its services including the need for expansion, contractions, of scope and introduction of new services/service products.
Data mining
Research
Health Management Information System
In most countries The Ministry of health provide the leadership, perform the strategic planning and regulates all aspects of health. It takes on the responsibility for improving the health of the population by providing services either directly or by facilitating other organizations (private sector, non-governmental organizations): These services include:
- Promotion of wellness
- Disease Prevention
- Early detection
- Facilitating health care service delivery in the country
In this respect the Ministry behaves as a large organization or an enterprise with the necessary managerial, administrative and support services to facilitate those activities. There is a need for it to set up a data warehouse and its attending software applications (often called the Health Management Information System) where data from its own institutions/offices and from all health care institutions (public, private and non-governmental) can be accumulated, analyzed and interpreted. The resultant information can help the ministry understand the current status and trends regarding:
- status of health of the population in general
- incidence and prevalence of various diseases
- health care services utilization and needs
- conformance of institutions to laws and regulations relating to healthcare activities
With the help of the data available the government can provide the following services:
- Oversight of health care service delivery throughout the country
- Planning and funding for health promotion and disease prevention activities
- Develop or amend regulations in response to current needs and emerging trends .
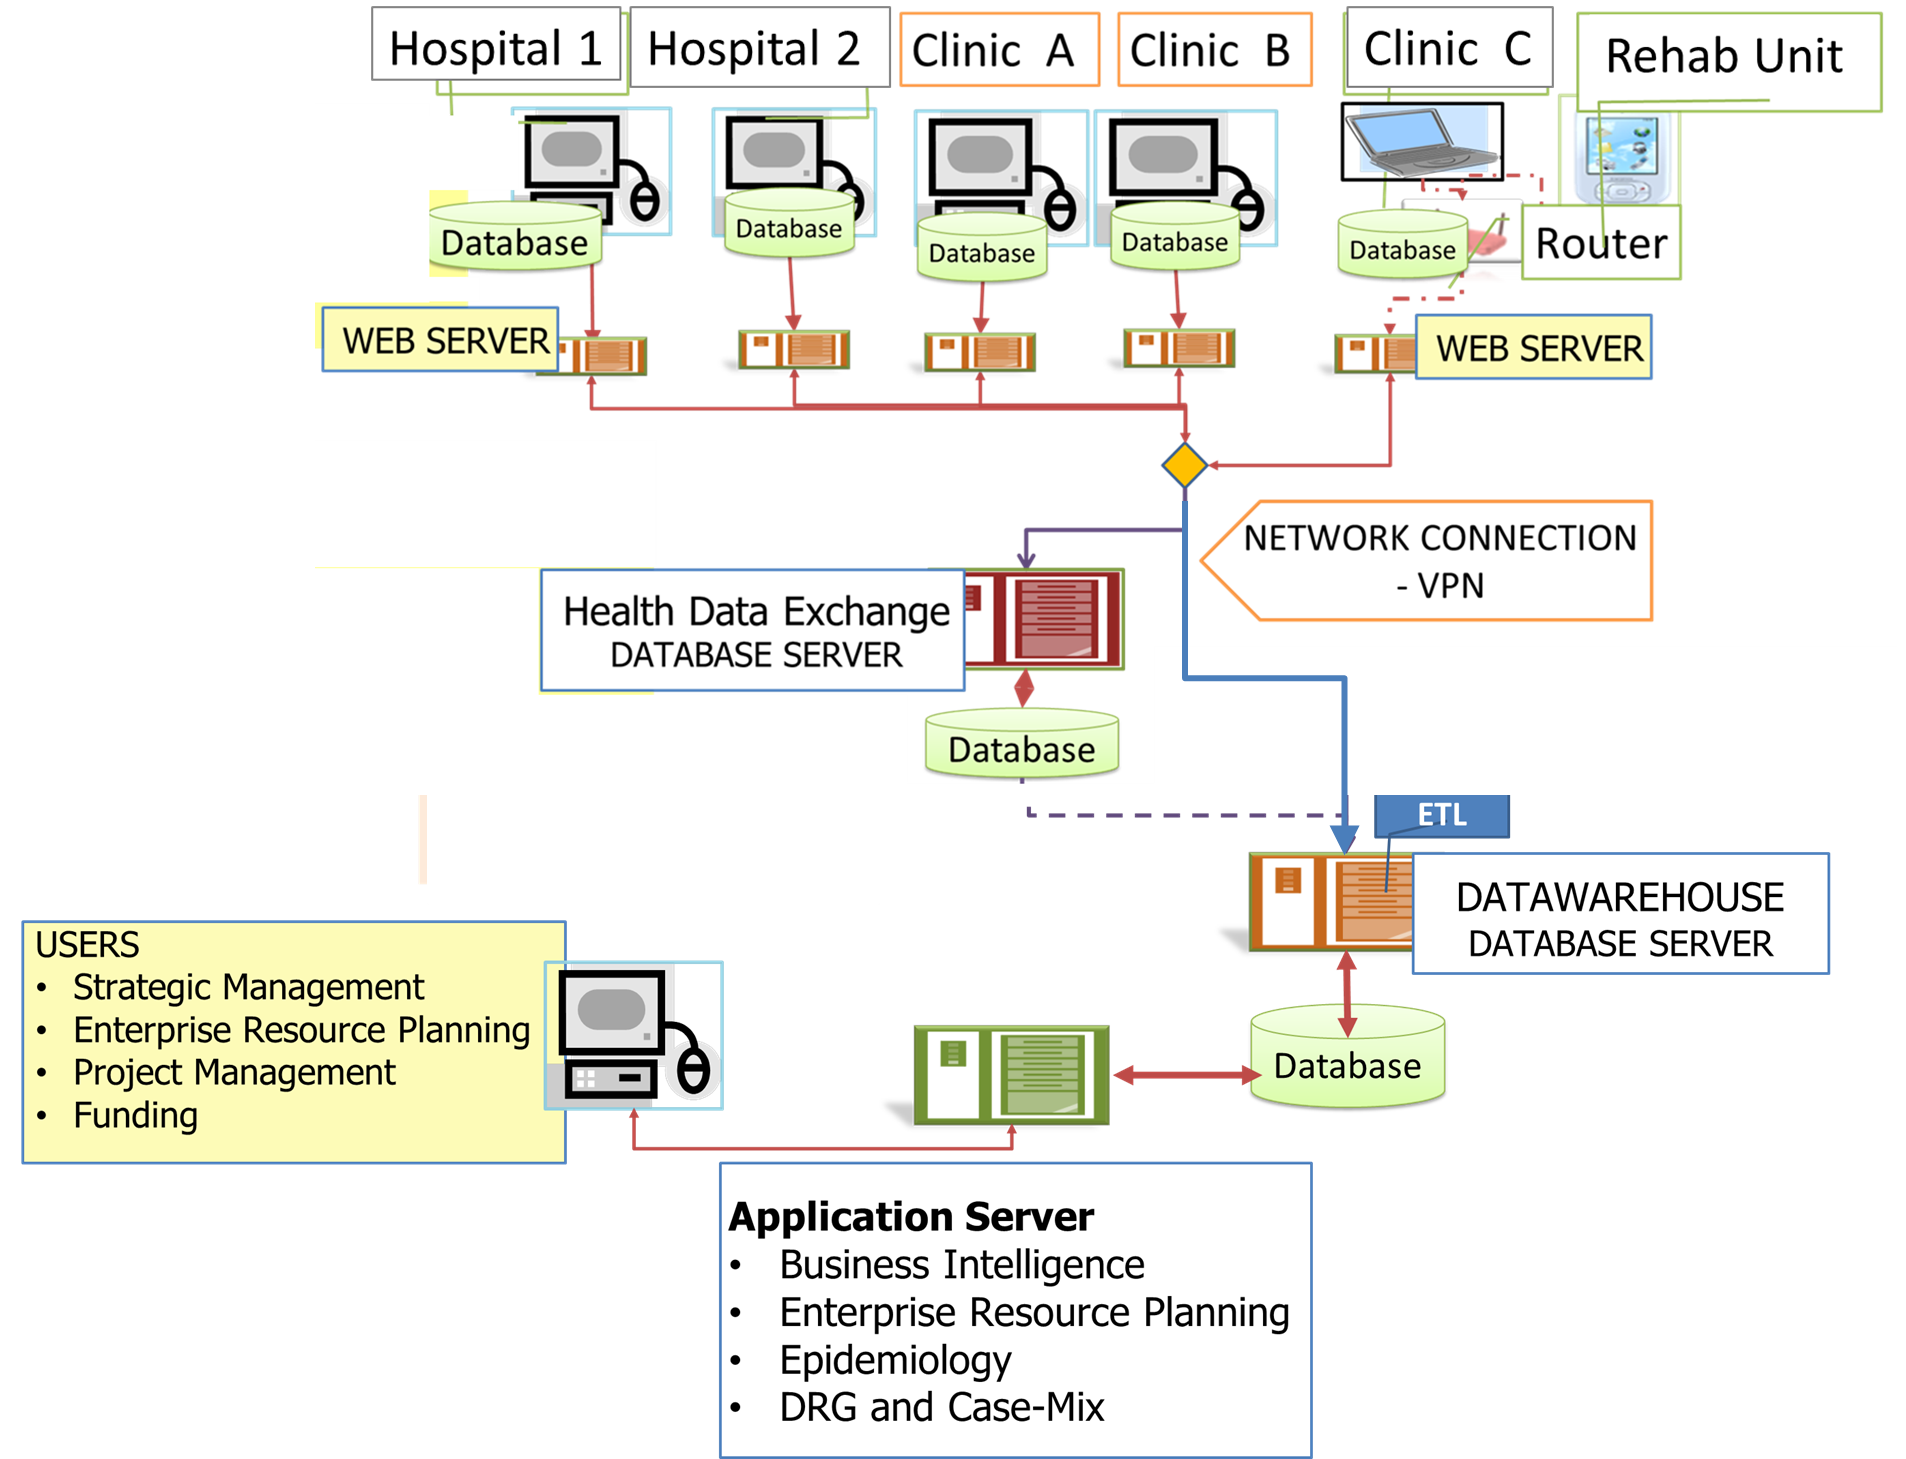
Network Supporting Enterprise-wide Data Management

quality research information on health care system
LikeLike